Many organisations have tracing on the services built in the last few years and nothing on the rest: the legacy Java monolith, the vendor binary, the Go service whose author left. Instrumenting each one with an SDK means code changes, releases and ownership that often doesn't exist. So the gaps stay, and incidents in those gaps take longest to resolve.
What OBI does
OpenTelemetry eBPF Instrumentation uses eBPF to inspect application executables and the operating system's networking layer, capturing trace spans, rate-errors-duration metrics, runtime metrics and service relationships for supported Linux workloads, without modifying application code or configuration1. The documentation lists support for languages including Java, .NET, Go, Python, Ruby, Node.js, C, C++ and Rust, visibility into TLS traffic without decryption, context propagation across services, and configuration-free auto-instrumentation on Kubernetes1.
That last point matters most in practice. On a cluster, you can get a baseline service map and latency metrics for everything in days, not quarters.
Log correlation without touching the app
A recent addition addresses a common incident pain: you have a failing trace, but no way to find the matching log lines because the service never added trace context to its logs. OBI can now add trace and span IDs to logs written to stdout or stderr, because through eBPF it knows which request each thread is serving at the moment of the write3.
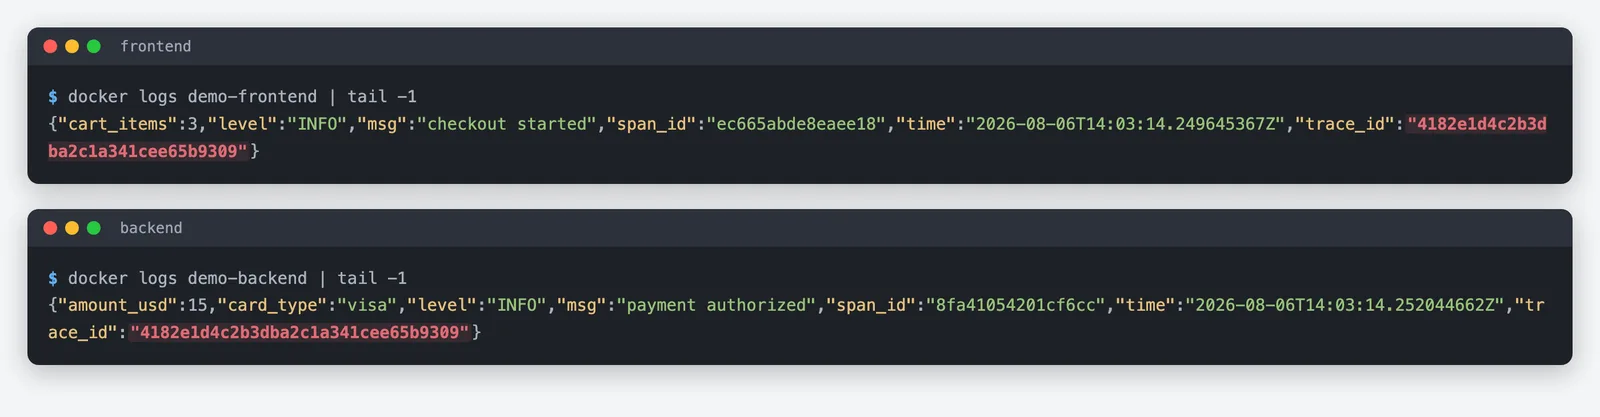
The boundaries are stated clearly: it applies to stdout and stderr, only annotates lines written while OBI has active trace context, needs elevated privileges, and on older kernels only some write paths are enriched; the common write path needs Linux 6.0 or later. It also needs a small change in the log pipeline3.
eBPF instrumentation is the fastest way to remove blind spots. SDKs are the way to add meaning. Most mature estates will want both.
Where it's heading in 2026
The OBI SIG's 2026 goals centre on a stable 1.0 release for production readiness, with complete configuration documentation, adoption of OpenTelemetry's declarative configuration and telemetry schemas, and test coverage targets. They also plan to expand protocols to messaging systems such as MQTT, AMQP, NATS and Redis pub/sub, extend database support, instrument cloud service SDKs, broaden .NET support, and strengthen integration with OpenTelemetry SDKs for hybrid instrumentation2.
Check the project's current release status before production rollout4, and pilot in non-critical environments first, in line with the stability approach in OpenTelemetry's stable-by-default push.
OBI or SDK?
| OBI (eBPF) | OpenTelemetry SDKs | |
|---|---|---|
| Code changes | None | Required |
| Coverage speed | Whole cluster quickly | Service by service |
| Business context | Limited to protocol-level data | Custom spans, attributes and events |
| Privileges | Elevated, node-level | Runs inside the application |
| Best for | Baselines, legacy and third-party services | Core services where detail matters |
How I'd roll it out
- Start with the blind spots. Deploy OBI where SDK instrumentation is missing, and compare the service map with what teams believe the architecture is.
- Route through your Collector gateway, as in Collector deployment patterns, so sampling, redaction and export are handled centrally.
- Review privileges with security. eBPF instrumentation runs with elevated access on nodes; treat it as platform infrastructure with the same controls as other node-level agents, enforced through admission policies.
- Check data sensitivity. Capturing protocol data, including from encrypted traffic, can expose sensitive values. Configure what is collected and redact at the gateway.
- Add SDKs where business context matters, such as checkout flows, AI calls with GenAI attributes, and regulated workflows.
- Watch cardinality and cost, since cluster-wide instrumentation can generate a lot of telemetry quickly.
How I can help
I design observability platforms that close blind spots quickly and add depth where it matters, using OpenTelemetry end to end. As a fractional CTO I can own the observability roadmap. Or analyse your challenge and bring the result to a call.
- 1OpenTelemetry eBPF InstrumentationOpenTelemetry documentation
- 2OpenTelemetry eBPF Instrumentation 2026 goalsOpenTelemetry blog · 23 Jan 2026
- 3Zero-code trace-log correlation with OBIOpenTelemetry blog · 6 Oct 2026
- 4opentelemetry-ebpf-instrumentationOpenTelemetry, GitHub