Most teams adopting OpenTelemetry start by pointing their SDKs straight at a vendor endpoint. It works for a demo. At scale it means every service holds backend credentials, sampling decisions happen in hundreds of places, and switching vendors requires redeploying everything. The OpenTelemetry Collector fixes that, but where you run it matters.
The agent pattern
In the agent pattern, a Collector runs alongside the application or on the same host, as a sidecar or a Kubernetes DaemonSet. Applications send OTLP to it, and it exports to one or more backends1.
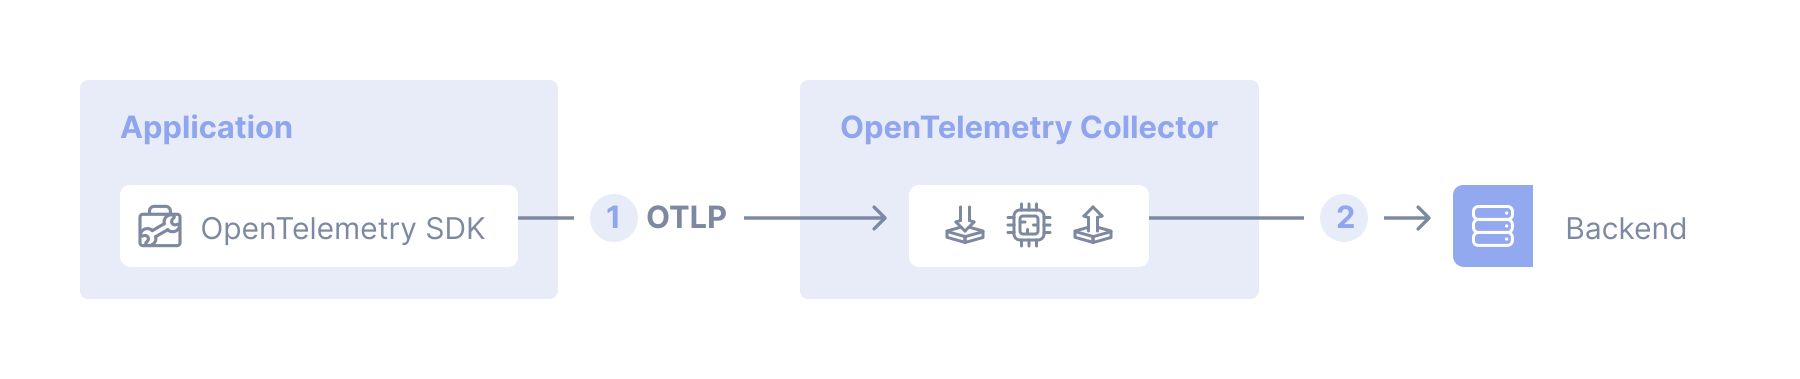
Agents are good at collecting host-level data, adding local metadata such as Kubernetes attributes, and buffering briefly when the network hiccups. They're poor at decisions that need to see a whole trace, because each agent only sees its own host's spans.
The gateway pattern
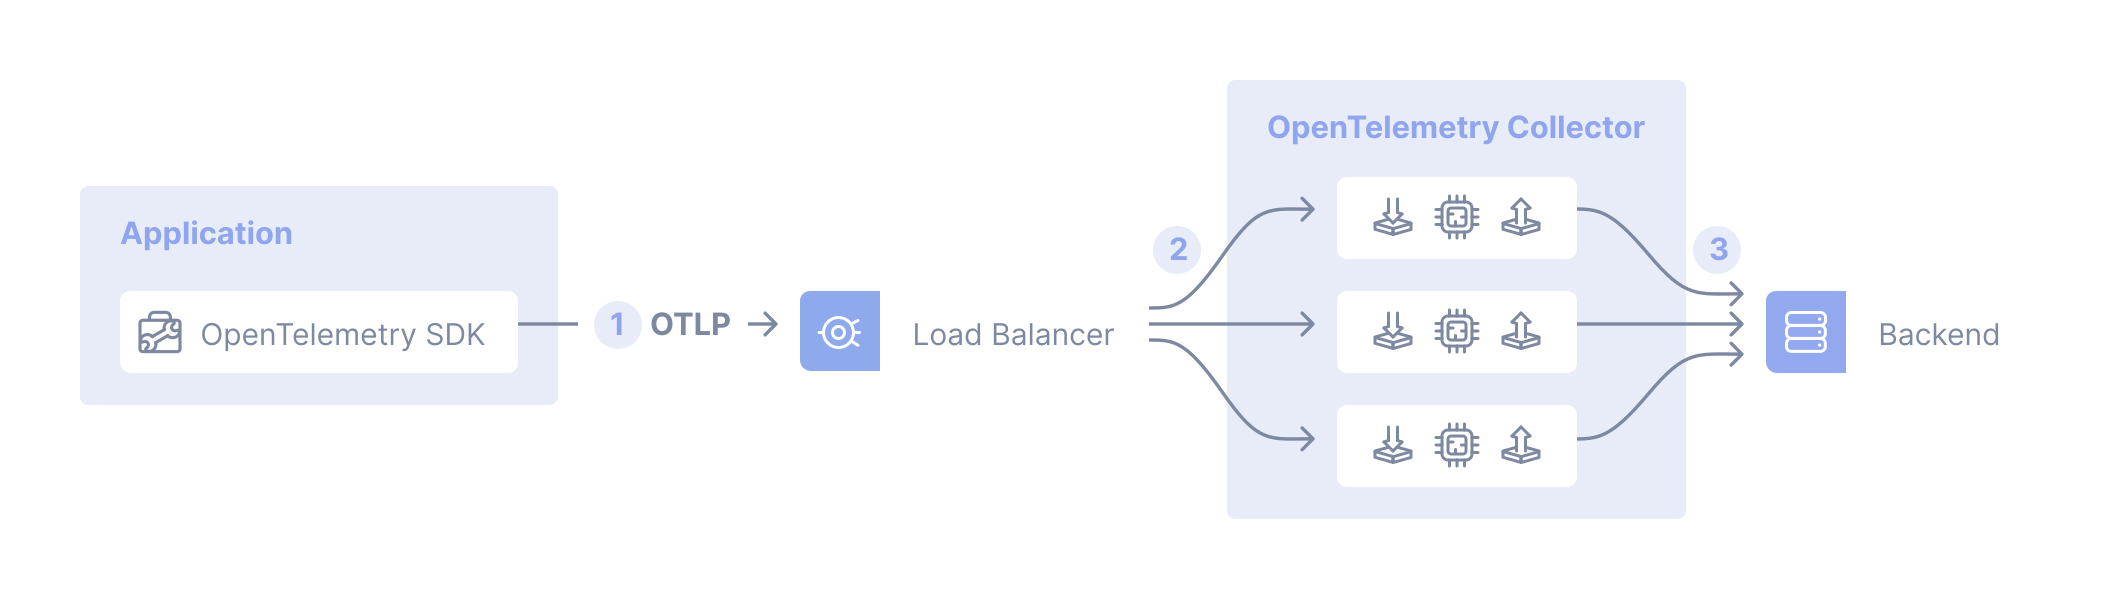
In the gateway pattern, applications or other Collectors send telemetry to a single OTLP endpoint served by Collector instances running as a standalone service, typically one endpoint per cluster, data centre or region2. A simple version puts an ordinary load balancer in front of Collector replicas.
For tail sampling, that isn't enough: every span of a trace must reach the same Collector. The documented answer is two tiers. The first tier uses a load-balancing exporter that routes by trace ID or service name; the second tier runs processors such as tail sampling2.
Agent-to-gateway: the usual answer
OpenTelemetry's documentation describes combining the two, and gives three reasons3:
- Separation of concerns. Agent configuration stays small; heavy processing lives centrally.
- Scalable cost control. Gateways see complete traces, so sampling and batching decisions are better, and they scale independently.
- Security and stability. Agents talk to gateways over internal networks; gateways are the stable egress point that manages retries and credentials.
Credentials for your observability vendor should live in a handful of gateway pods, not in every service. That alone justifies the gateway for most organisations.
How I choose
| Situation | Pattern |
|---|---|
| Small team, one cluster, low volume | Agent only, or SDK straight to a single gateway |
| Need host metrics and Kubernetes metadata | Agents as a DaemonSet |
| Need tail sampling or central PII redaction | Two-tier gateway |
| Multiple clusters or regions, data residency rules | Agent-to-gateway, with a gateway per region |
| Sending to more than one backend | Gateway, so routing changes in one place |
Practical rules
- Redact centrally. Put PII and secret scrubbing in the gateway so one policy covers everything, especially for prompt and response content in LLM observability.
- Keep data in region. For GCC and EU workloads, a regional gateway makes residency rules enforceable, as in Saudi PDPL and cross-border AI.
- Sample where you can see the trace. Head sampling in SDKs is cheap but blind; tail sampling in the gateway keeps errors and slow traces.
- Monitor the Collectors themselves: queue sizes, dropped data and export failures. A silent pipeline failure looks like a quiet system.
- Plan for new signals. Profiles now flow through the Collector too4, as covered in OpenTelemetry Profiles. A gateway layer makes adding them a configuration change.
How I can help
I design observability platforms on OpenTelemetry, from Collector topology and sampling to redaction and cost control. As a fractional CTO I can own that roadmap. Or analyse your challenge and bring the result to a call.
- 1Agent deployment patternOpenTelemetry documentation
- 2Gateway deployment patternOpenTelemetry documentation
- 3Agent-to-gateway deployment patternOpenTelemetry documentation
- 4OpenTelemetry Profiles Enters Public AlphaOpenTelemetry blog · 26 Mar 2026