A familiar pattern in health data projects: the team gets access to a new OMOP database, and within a week someone is training a risk model. A month later the model behaves strangely, and the cause turns out to be something basic. Half the patients have under a year of observation, a whole drug class is missing from one source, or the "new users" are mostly people transferring in from another system.
Characterisation is how you find those things first. The Book of OHDSI describes four methods, each answering a different question1.
Four kinds of characterisation
| Method | Question it answers | Typical use |
|---|---|---|
| Database-level | What is in this database at all? | Fitness for purpose, data quality, spotting gaps |
| Cohort characterisation | Who are these people, before and after the index date? | Natural history, drug utilisation, study feasibility |
| Treatment pathways | What sequence of treatments do people receive? | Treatment patterns, switching, guideline adherence |
| Incidence | How often does a new outcome occur in a population? | Disease burden, safety signals, baselines for models |
All except database-level characterisation describe a population relative to an index date defined by a cohort. Time before the index date is baseline; the index date and after is post-index1. That is why good cohort definitions come first.
Start with the database
Before any population question, describe the database: how many people, their age distribution, how long they are observed, and how the recording of treatments, conditions and procedures changes over time. These summaries also reveal what may be missing1, which is why they pair naturally with OMOP data quality checks.
Characterise the cohort broadly
OHDSI's approach to cohort characterisation is deliberately broad: descriptive statistics across all conditions, drug and device exposures, procedures and other observations in a person's history, plus demographics at the index date. That gives a complete picture of the population and helps surface variation and missing values1. The FeatureExtraction package produces these features in a standard way, so the same characterisation runs at every site4.
The book notes that disseminating this kind of characterisation is recommended practice in the STROBE guidelines for reporting observational studies13. Practically, a baseline table is also the fastest way to check your cohort is the population you think it is.
If the baseline table surprises you, stop. The surprise is either a finding or a data problem, and both matter more than the model you were about to train.
Treatment pathways
Pathway analysis summarises the sequence of treatments people receive after a starting event, such as a diagnosis or first prescription. In a landmark study across the OHDSI network, Hripcsak and colleagues used standardised pathway analyses for type 2 diabetes, hypertension and depression, running the same analysis across many databases2. The book reports that they found metformin to be the most common diabetes medication, consistent with first-line guidance, and that 10% of diabetes patients, 24% of hypertension patients and 11% of depression patients followed a treatment pathway shared with no one else in any of the data sources1.
That last finding is a useful reminder for anyone designing clinical AI: real-world care is far more varied than guidelines suggest.
Incidence, defined precisely
Incidence measures new occurrences of an outcome in a population during a time at risk. The book defines two metrics1:
- Incidence proportion: people in the cohort with a new outcome during the time at risk, divided by people in the cohort with time at risk.
- Incidence rate: people with a new outcome divided by the total person-time at risk, where each person's time stops when the outcome occurs.
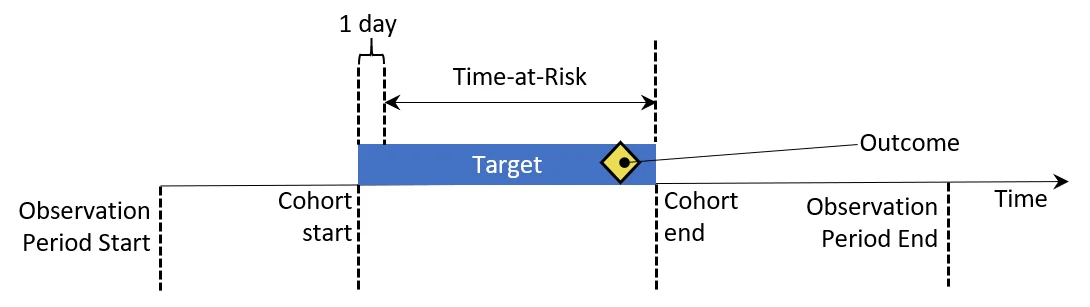
Most disagreements about "the rate" of something trace back to different choices of cohort, time at risk or outcome definition. Writing those down explicitly is what makes incidence comparable across sites and studies.
Where characterisation fits
- Database characterisation when a source joins the platform, and after every major load.
- Cohort characterisation before any study or model, to confirm feasibility and population.
- Pathways and incidence to understand current practice and baselines.
- Then prediction or effect estimation, with the characterisation published alongside the results.
How I can help
I design OMOP platforms where characterisation runs automatically on every load and every new cohort, so analysts and AI teams start from facts rather than assumptions. See healthcare data architecture, or analyse your challenge and bring the result to a call.
- 1
- 2Characterizing treatment pathways at scale using the OHDSI networkHripcsak et al., PNAS 113(27) · 2016
- 3The Strengthening the Reporting of Observational Studies in Epidemiology (STROBE) statementvon Elm et al., Journal of Clinical Epidemiology · 2008
- 4