Most observability programmes stop at three signals: traces, metrics and logs. They tell you that something is slow or expensive and roughly where. They rarely tell you why at the level of code. That is what profiling does, and until recently every profiling tool used its own agent and format.
On 26 March 2026 the OpenTelemetry Profiling SIG announced that the Profiles signal had entered public alpha1. It is not ready for critical production use. It is ready for teams to start planning around.
What the alpha includes
According to the announcement, there are three parts1:
- A standard data format. Stacks are deduplicated and common values stored in dictionary tables for efficiency. Samples can carry trace and span IDs for correlation with traces. Data in pprof format can be converted to and from OTLP Profiles with no loss of information.
- A reference eBPF profiler. Donated by Elastic in 20243, it provides whole-system profiling on Linux without instrumenting applications. In the alpha it runs as an OpenTelemetry Collector receiver, shipped as an official Collector distribution, with additions including .NET 9 and 10 support and initial BEAM support14.
- Collector integration. A pprof receiver, Kubernetes metadata enrichment and OTTL transformation rules work with profiles, and Collector v0.148.0 or newer supports the signal1.
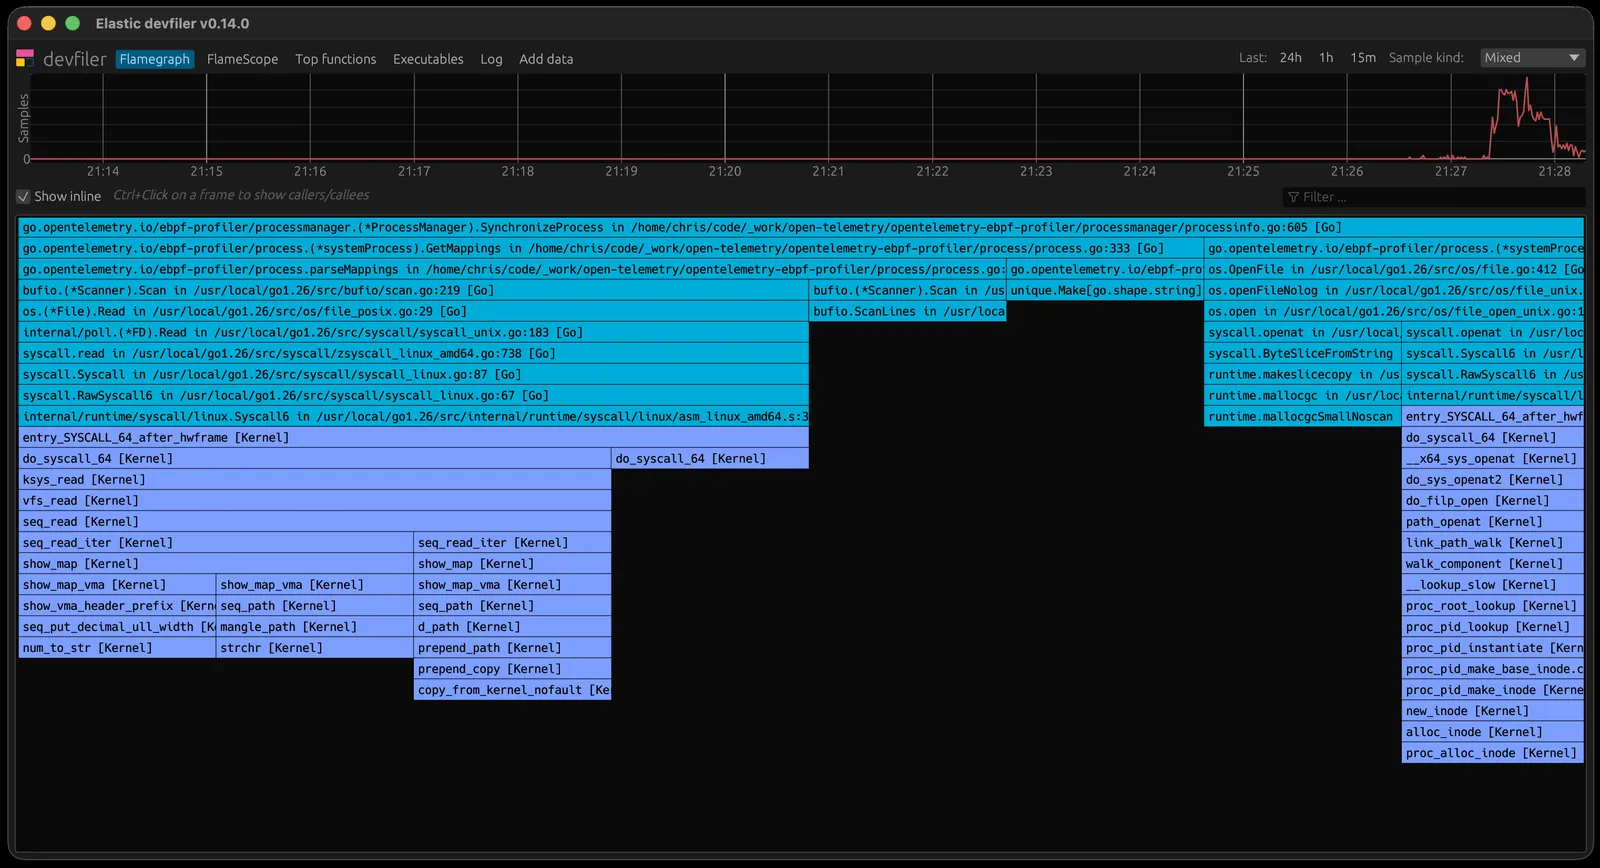
Two caveats from the project itself: the signal should not be used for critical production workloads at alpha, and production-ready backends had not yet emerged at the time of the announcement1.
Why this matters
Correlation. The ability to link a profile sample to a trace and span is the real prize. A slow span becomes a flame graph of exactly what that request was doing, without switching tools or guessing.
Cost. Profiling across a fleet shows which functions consume the most CPU and memory. That turns cost work from "buy smaller instances" into "fix the three hot paths", which complements the infrastructure levers in Kubernetes FinOps.
Portability. As with traces, a standard format means you can change profiling backends without re-instrumenting. Vendors in the profiling space have been part of the effort5, which suggests support will follow.
Profiling is the observability signal most teams skip, and the one that most often pays for itself. A standard makes it much easier to justify.
What about AI workloads?
For AI platforms, profiling helps in the parts around the model: tokenisation, retrieval, serialisation, preprocessing and orchestration code, which often consume more CPU than teams expect. Combined with the GenAI tracing conventions in LLM observability with OpenTelemetry, it gives a complete picture of where time and money go in a request. GPU-side profiling is a separate problem; check what your chosen tools cover.
How I would pilot it
- Pick a non-critical environment such as staging or a performance test cluster, in line with the alpha guidance.
- Deploy the eBPF profiler Collector distribution on a few nodes, with Kubernetes metadata enrichment, and check the overhead yourself.
- Choose a backend that accepts OTLP Profiles, or use a development tool to explore the data while backends mature.
- Answer one real question, such as the top CPU consumers of your most expensive service. A pilot with a concrete finding wins support for wider rollout.
- Keep the pipeline in your Collector configuration, so that promoting it to production later is a configuration change, not a new project.
If you already run continuous profiling with a vendor agent, there is no need to rip it out. Ask the vendor about OTLP Profiles support and plan the switch for when the signal reaches beta.
How I can help
I design observability strategies across traces, metrics, logs and now profiles, with a focus on finding cost and reliability problems quickly. As a fractional CTO I can own that roadmap. Or analyse your challenge and bring the result to a call.
- 1OpenTelemetry Profiles Enters Public AlphaOpenTelemetry blog · 26 Mar 2026
- 2Profiles (signal concepts)OpenTelemetry documentation
- 3Elastic contributes its continuous profiling agent to OpenTelemetryOpenTelemetry blog · 2024
- 4OpenTelemetry eBPF profilerOpenTelemetry, GitHub
- 5OpenTelemetry Profiling goes AlphaPolar Signals · 26 Mar 2026